How To Determine Product Success When You Lack Financial Data

Effectively Managing Product Lines for Product Managers
To effectively manage a product line, product managers and the teams they lead need financial data. However, often this data is unavailable. In fact, many product managers admit they either lack access to financial results or they have trouble interpreting the numbers they do get.
From our research, we’ve learned that some companies’ accounting systems are unable to supply product level data. And, when a company is selling a solution or bundled products, it’s difficult to identify the individual products in the sale because the transaction recorded is for a package of products and services. Even worse, senior managers with access to financial data may not share it with product managers, but use it for their own purposes. Yet, despite the lack of detailed financial statements, you can use alternate methods to get the numbers you need to help make the right business decisions for your products. One way is to use the profit and loss statement (P&L) as a template for the type of financial research that will help you determine how well your product is performing.
We call this looking for “proxy”or “surrogate”data.
BECOME A PRO AT SNIFFING OUT SURROGATE DATA

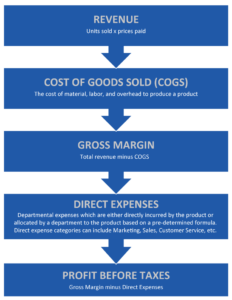
To uncover surrogate data, it helps to understand the structure of the P&L statement, (also called the Income Statement) as shown in the diagram to the left. If you keep this general structure in mind, you’ll find it easier to find the data you need to help you determine your product’s profitability. Let’s take an example.
UNDERSTANDING REVENUE
Suppose you don’t know how many units of your product have been sold. Your first question should be, “How are our products sold?” Since the Sales department is responsible for selling, and since salespeople want to get paid commissions, they surely keep track of who’s buying, how much they buy and how much they pay.
It pays, therefore, to establish a rapport with the sales teams in order to collect their data. Even better, sit with the heads of Sales and Accounting to figure out how you can get the same data. Attend monthly Sales meetings or conference calls. If your company tracks Sales units by region or sales territory, and you compare these numbers to forecasts and prior periods, you can gain an understanding of the general trends in how your product is performing.
UNDERSTANDING GROSS MARGIN
Revenue minus Cost of Goods Sold (COGS) equals Gross Margin (GM), and since GM is one of the best measures of product profitability (within the control of the product manager and/or his or her team), you need to understand the source of COGS.
Best Practice: Look to cross-functional team members for help in putting together a picture of the business.
The Result: your cross-functional team can help identify strategic and tactical options on which to base appropriate marketing mix decisions.
If your company produces tangible products (versus services), look at materials, labor, and overhead. Two departments typically keep track of this data —Accounting and Purchasing. Purchasing is responsible for the procurement of materials from suppliers. When a supplier sells to a company, the detailed invoice shows the materials which are purchased. Accounting is responsible for establishing cost models for the product (called ‘standard cost’), which is similar to a budget for product costs.
If your company manufactures these goods, you have to measure actual usage against the standard cost (or budget) to see if you’re higher or lower (that’s the variance). You can work through all of the COGS elements with Accounting and Purchasing to determine how much your product is actually costing. When taken together with proxy Revenue data, you’ll have a rough snapshot of product profitability.
OVERWHELMED? LOOK TO YOUR CROSS FUNCTIONAL TEAM
If re-creating the financial statements seems a little overwhelming, let’s consider how your cross-functional team can help.
Sales – In addition to the information above, Sales probably has information on quotation rates (increasing or decreasing?), win/loss analysis (Why are we winning? Why are we losing?) and other information, both anecdotal and factual.
Your sales team can help you gauge what’s going on in your markets and with competitors.
Customer Service – The Customer Service department typically runs the call center, which relies on a contact management or customer relationship management (CRM) system to make notations in customer records when customers call in to order products or to make a complaint.
You can determine product quality issues by asking for the number of complaints and their frequency.
Manufacturing – For tangible goods, manufacturing typically keeps track of orders, backorders, and warranty returns. Backorder trends can help you determine if demand is increasing or decreasing for your products. We all know what warranty return trends mean – increasing warranty returns is a precursor to customer dissatisfaction.
Any and all of these items can and should be standing agenda items for your monthly cross-functional team meetings. Best Practice: Look to cross-functional team members for help in putting together a picture of the business.
The result? Your cross-functional team can help identify strategic and tactical options on which to base appropriate marketing mix decisions. As we said before, to effectively manage a product line, product managers and the teams they lead need financial data.
Our best practices benchmarking shows that more successful product managers act as mini-CEO’s, managing a product or product line as if they were running their own business. Sometimes you are faced with an environment where data is not centralized, consolidated, or easily accessible. However, to run a business, you need to understand the financial results and trends, even if it means having to go and dig for information.